Kotlin Notebook Features
This notebook demonstrates the features available when working with kandy-lets-plot in Kotlin Notebook
Swing render
By default, Kotlin Notebook uses Swing to display plots:
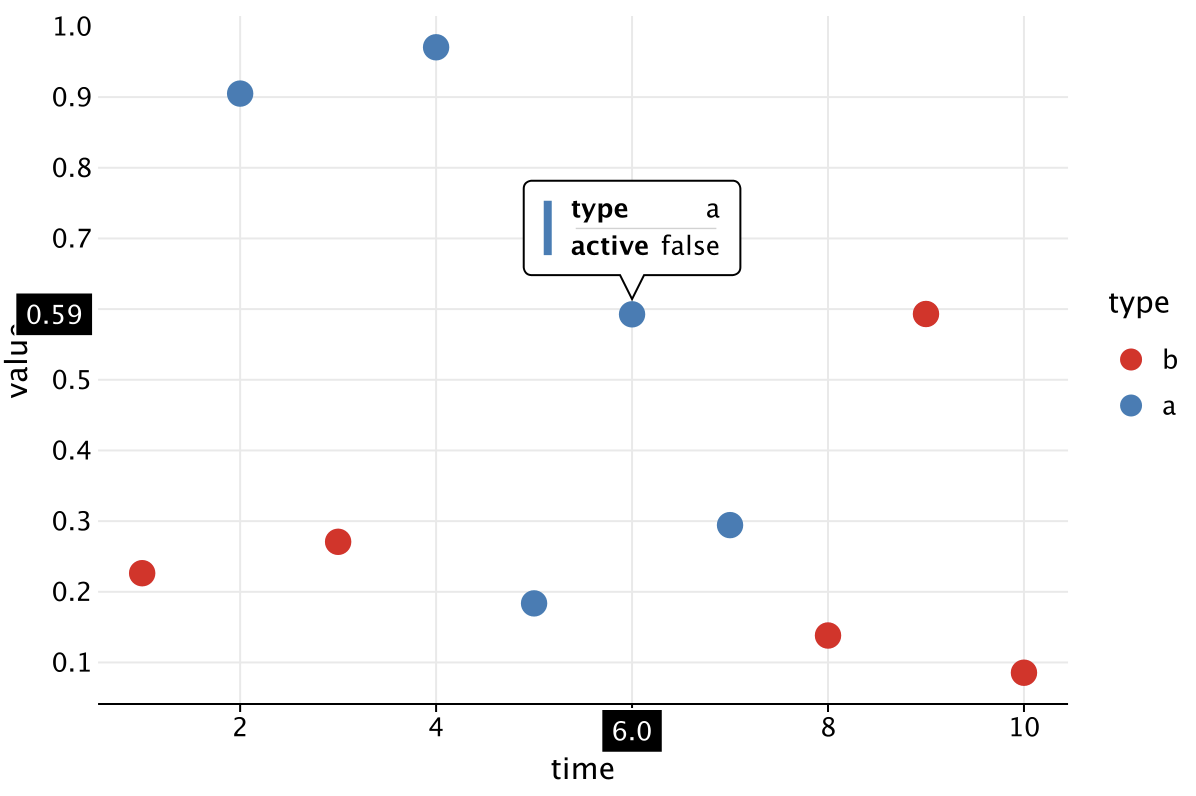
Swing rendering has a lot of advantages: it is more performant (when using tooltips), you can change its size (in this case it will be scaled), and also has a dynamically changing color scheme (see the relevant section).
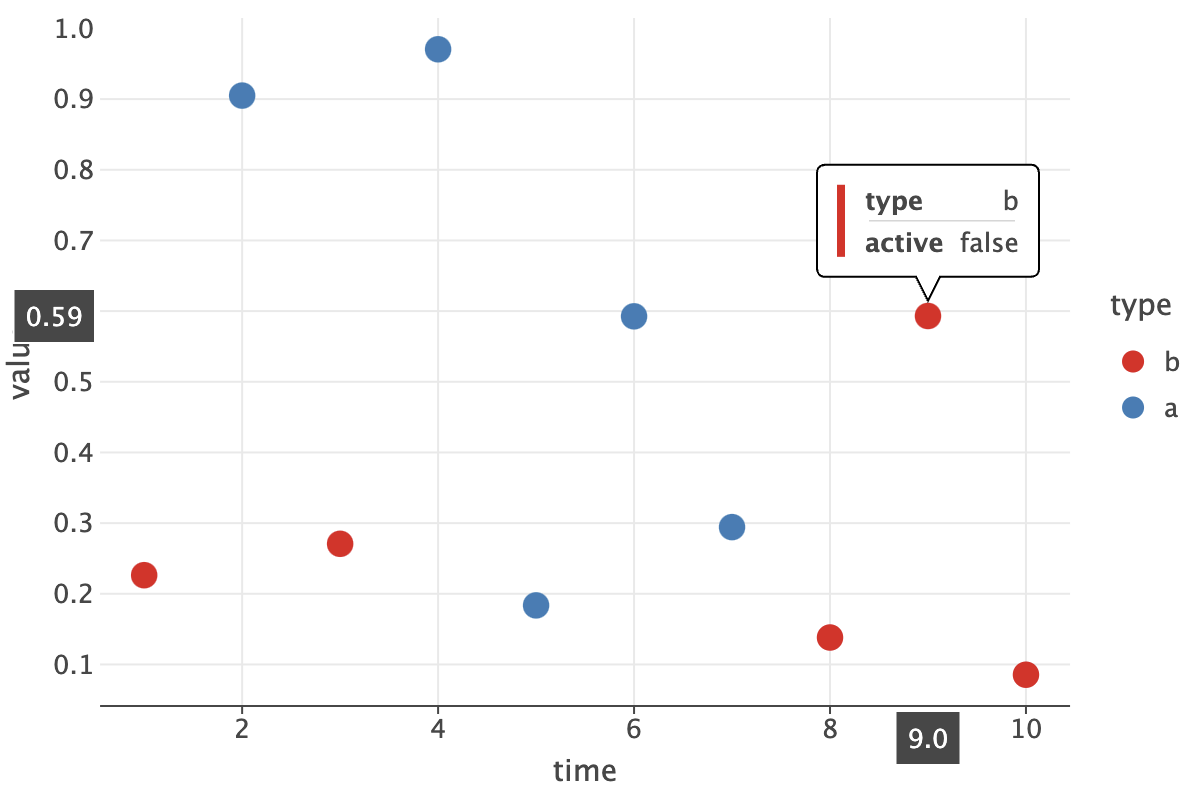
However, you can disable it manually and use web rendering (may not work at all in Kotlin Notebook — try to restart kernel). To do this, before displaying the plot, it is necessary to change the corresponding option in kandyConfig (notebook parameter).
Dynamic color scheme
If you are using a non-light color scheme in the editor, you may have noticed that the swing-rendered plot has automatically changed its theme to match the environment theme. If not already, you can check this by changing the theme of your editor to, for example, Darcula. Even without restarting the cell, the next plot (just like the first swing plot) will change the theme to match yours.
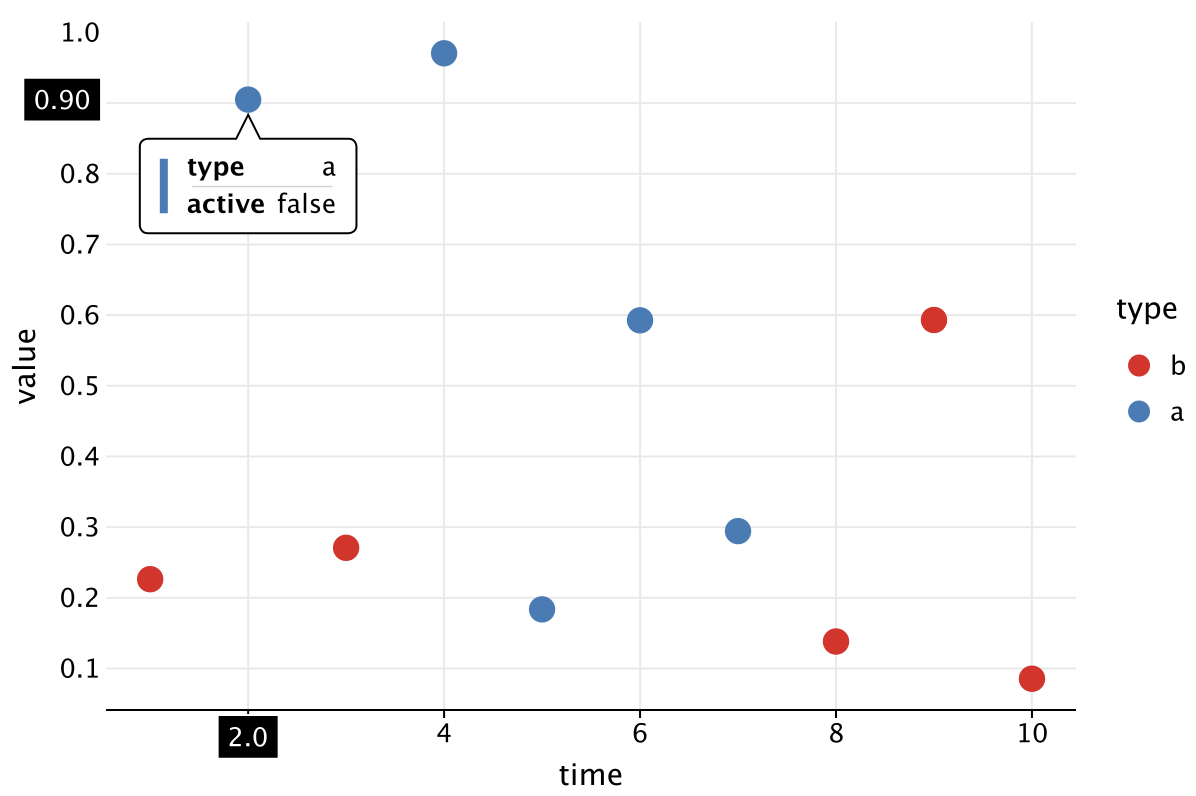
To disable the automatic theme change, you need to change the corresponding flag in kandyConfig:
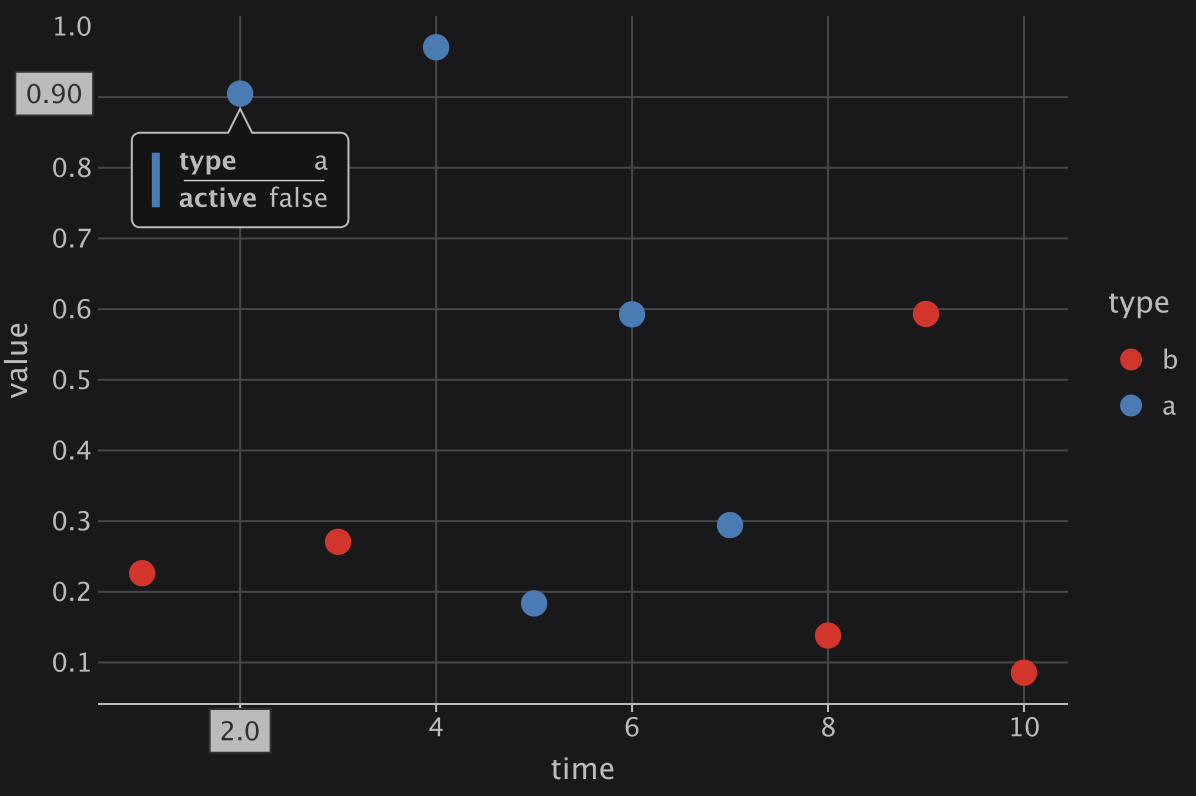
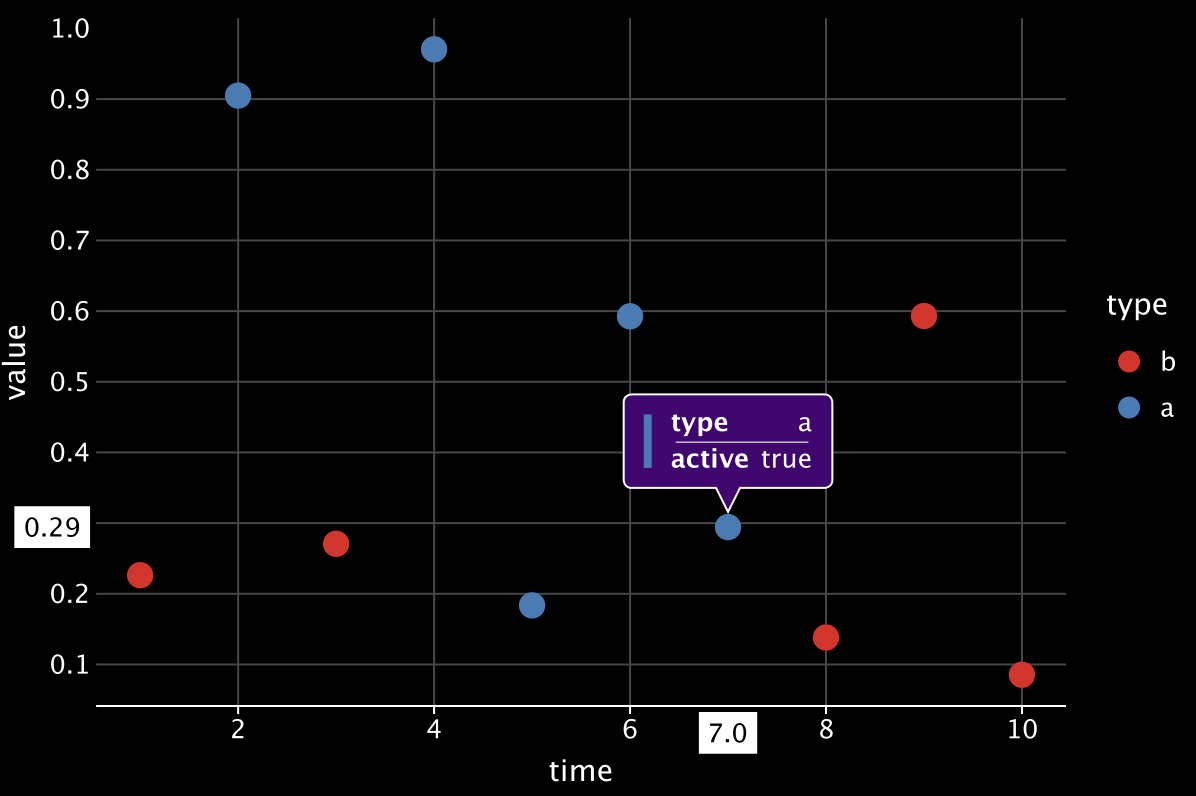
Also note that automatic theme change does not work if you set the theme manually (via layout.flavor):
Plot Export from Output
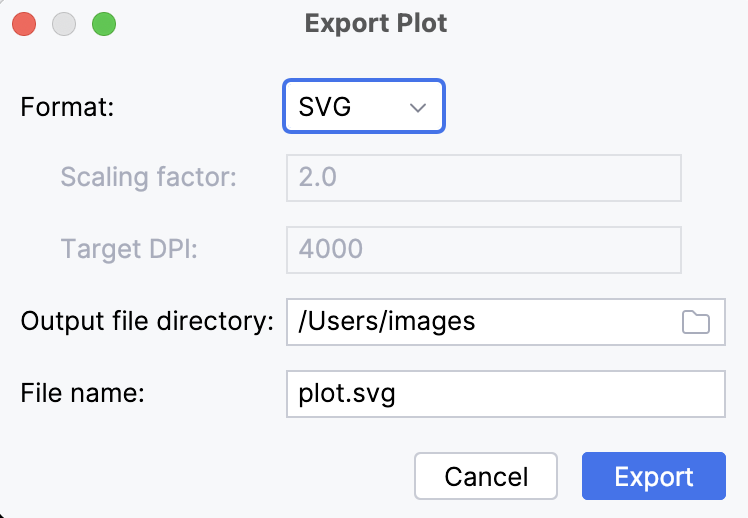
You can export plot from the cell output with the "Export Plot As..." button in the output menu or with "Export Plot As..." action.
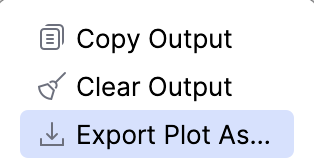
After that, a settings menu will open where you can select the image format, the path to where you want to save it, as well as the file name itself.
