Kandy in Datalore
Datalore is a collaborative data science platform designed to streamline insight delivery, facilitating more productive collaboration between data science and business teams. This platform is adept for tasks such as data collection, exploration, machine learning, interactive visualization, and reporting.
Datalore supports Python, Kotlin, Scala, and R notebooks without the need for preliminary setup, offering computational resources tailored to your requirements.
Getting Started with Datalore
Open Datalore.
Register if you don't already have an account.
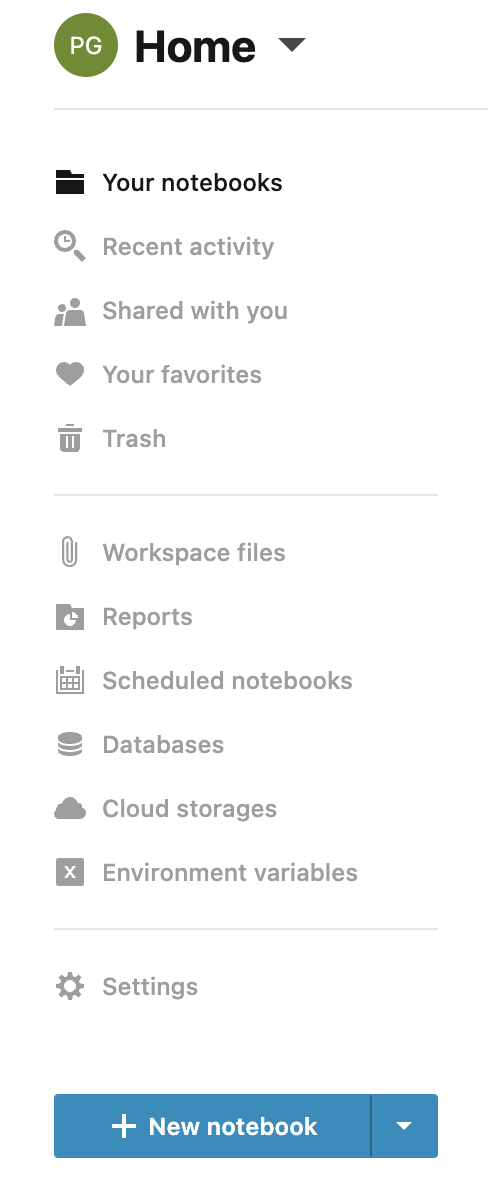
On the home page, click on the button.

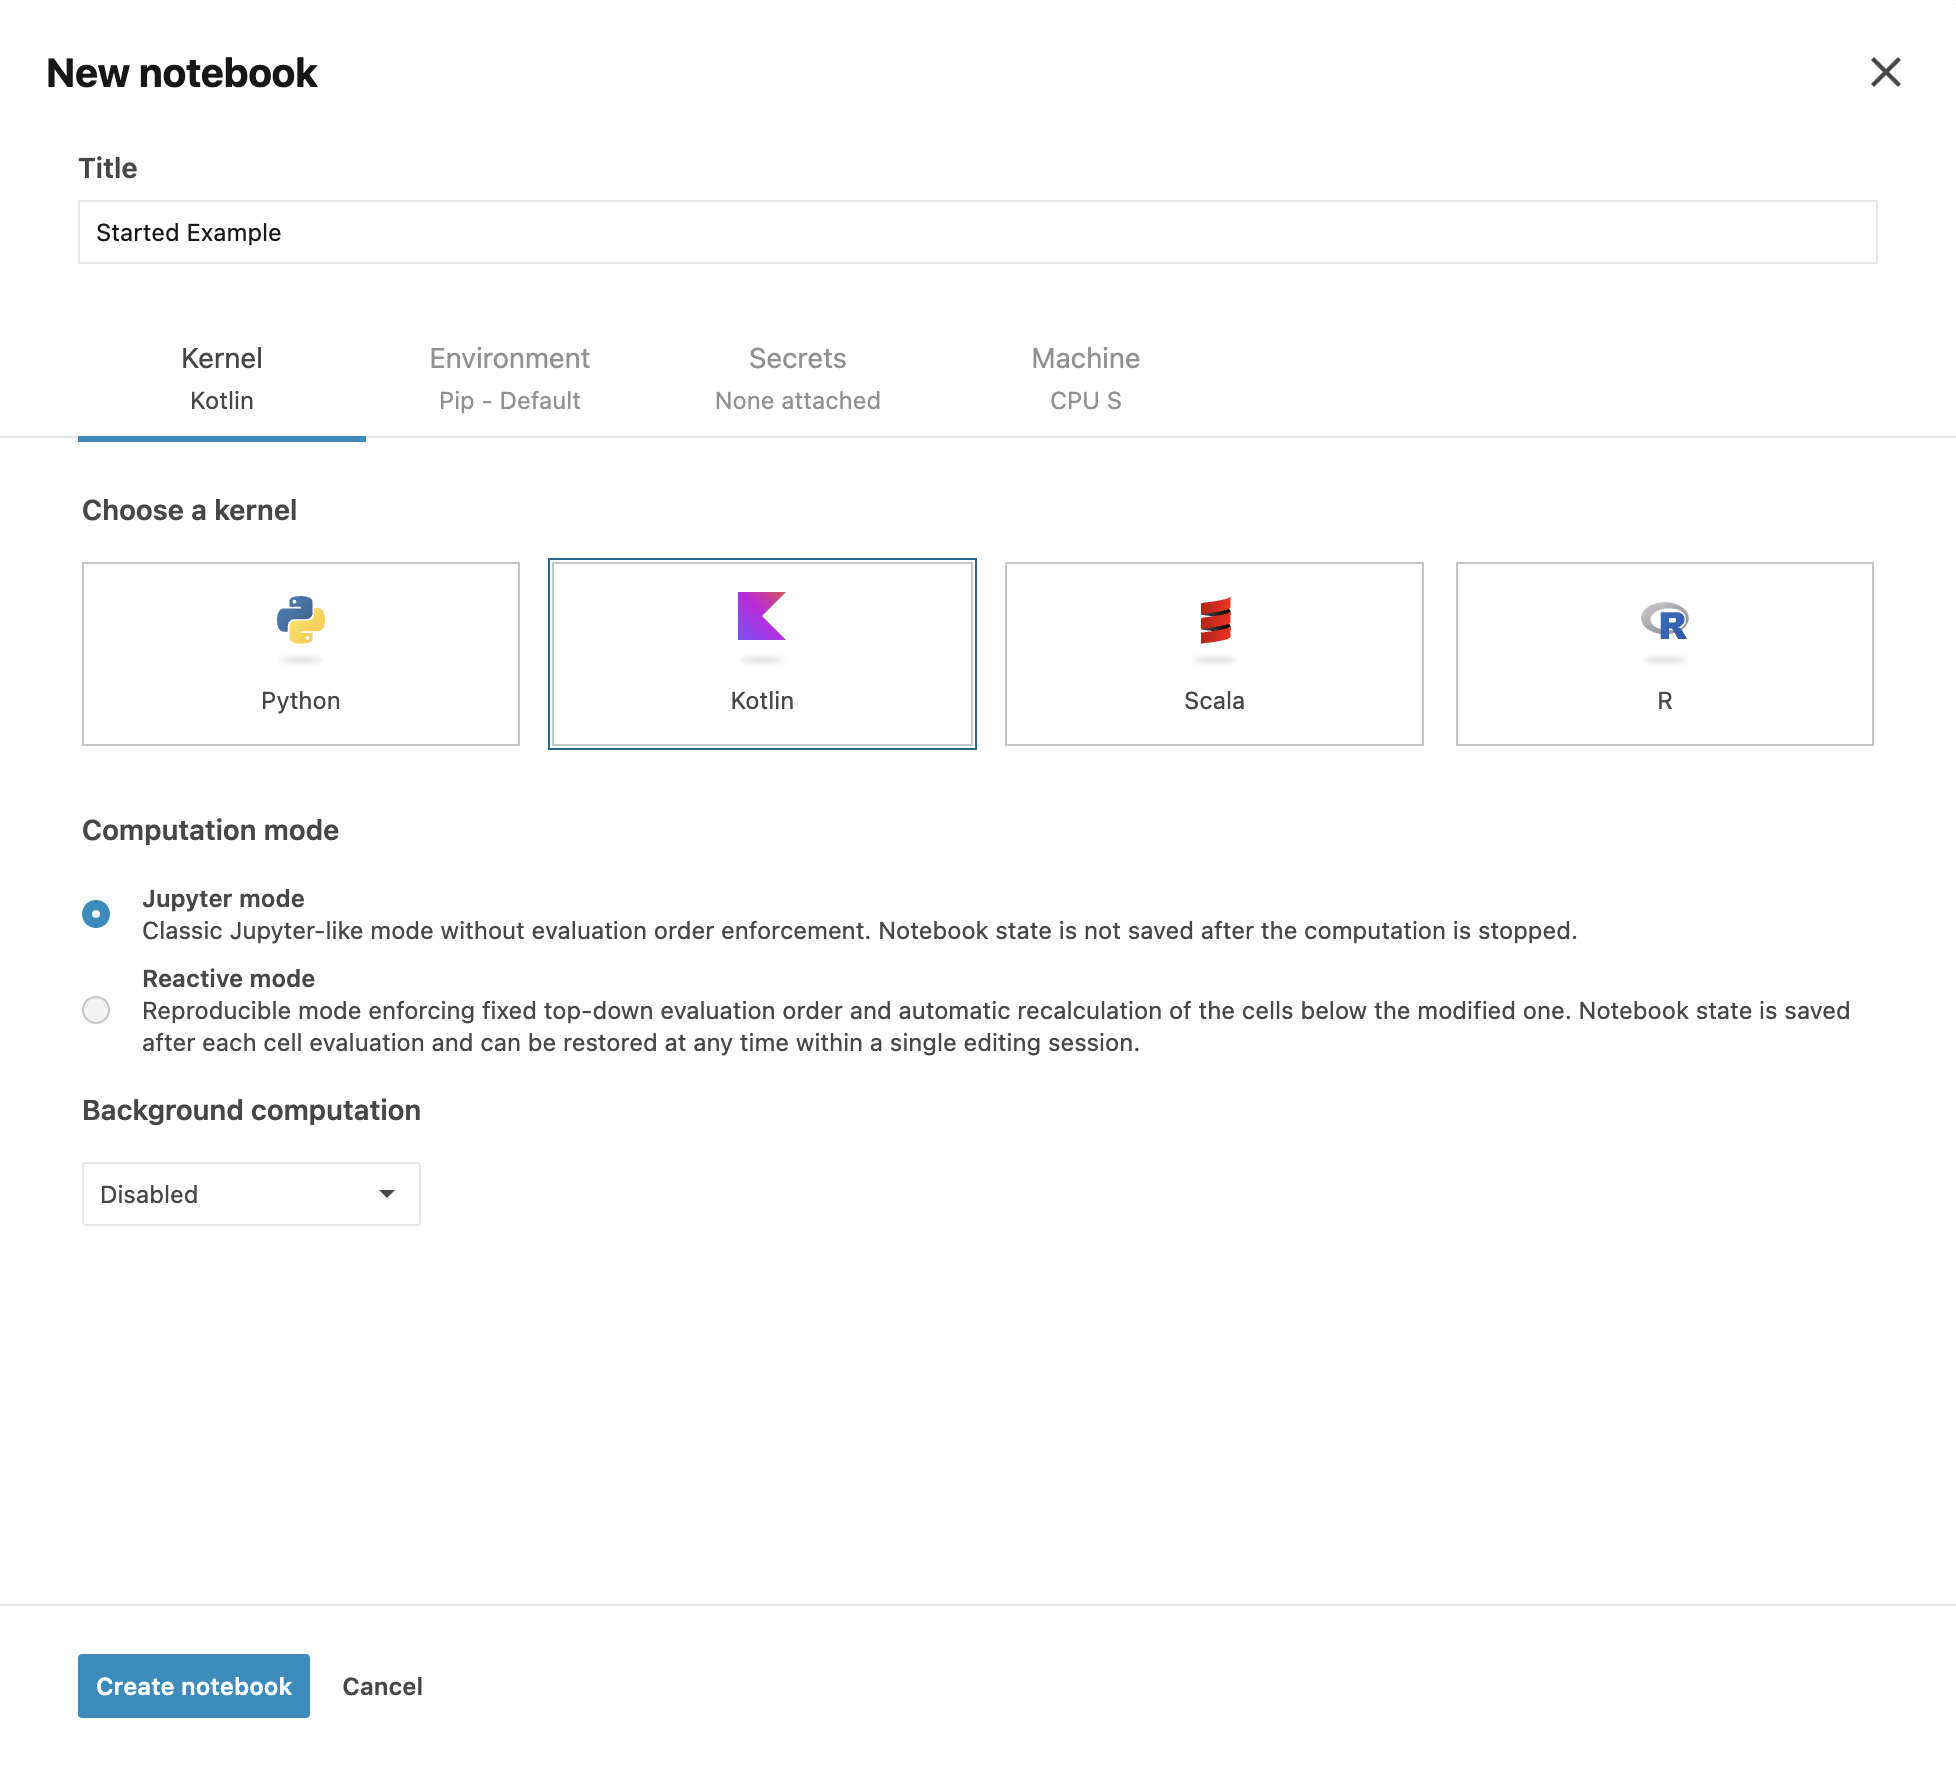
You will be redirected to the page where you can set the notebook's title, select a kernel, choose a computation mode, and configure various other settings.
Select the Kotlin Kernel and click .

In the notebook, execute the following cell to add the Kandy library:
You now have access to the Kandy library within your Kotlin Notebook in Datalore.
Plotting a Simple Example
Let's create data that will be used to construct the plot. This data will represent the average annual temperatures in various cities. When working in interactive notebooks, it is advisable to divide the data creation and plot construction into two separate cells. This approach ensures that extension properties are generated for our columns in the DataFrame, allowing us to reference them easily.
First, create a DataFrame containing data on the average temperatures in different cities as follows:
Next, construct a simple plot using the data from the DataFrame:
This supplementary schema outlines the key elements of Kandy's DSL, providing a quick reference to assist you in building your visualizations.
plot
For more examples, please see the Examples section.