Kandy in Jupyter Notebook
Jupyter is a renowned open-source project offering Jupyter Notebook for interactive computations across various programming languages. Jupyter Notebook facilitates the creation and sharing of documents containing code, equations, visualizations, and narrative text. It has become a staple tool amongst data scientists, researchers, and programmers for data visualization and analytical computations. Notably, the Jupyter project supports the Kotlin language through the Kotlin Kernel.
Getting Started with Jupyter Notebook and Kotlin
Jupyter Notebook and the Kotlin Kernel can be installed using either the conda package manager or pip. Here, we will outline both approaches:
Jupyter Notebook is included in the Anaconda distribution. To install Anaconda, download the installer from the official site and follow the installation instructions.
After completing the above step, install the Kotlin Kernel by executing the following command in the terminal:
Pip is included with Python. Hence, install Python using a method that suits you, preferably by downloading the installer from the official site.
Next, run the following command in the terminal to install Jupyter Notebook:
Additionally, install the Kotlin Kernel by executing:
You can find instructions for installing, uninstalling, and updating the Kotlin Kernel in the Kotlin Notebook documentation.
After installing both the Jupyter Notebook and Kotlin Kernel, launch Jupyter Notebook by entering one of the following commands in the terminal:
or
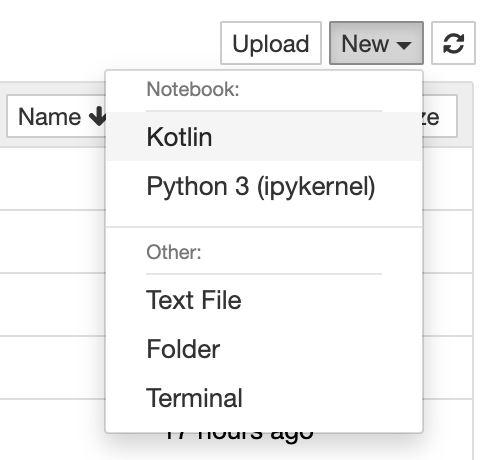
The Jupyter Notebook will open in your browser. Create a new notebook in the current folder by clicking the button located in the upper right corner and selecting from the dropdown menu.

In the notebook, execute the following cell to add the Kandy library:
You now have access to the Kandy library within your Kotlin Notebook in Jupyter.
Plotting a Simple Example
Let's create data that will be used to construct the plot. This data will represent the average annual temperatures in various cities. When working in interactive notebooks, it is advisable to divide the data creation and plot construction into two separate cells. This approach ensures that extension properties are generated for our columns in the DataFrame, allowing us to reference them easily.
First, create a DataFrame containing data on the average temperatures in different cities as follows:
Next, construct a simple plot using the data from the DataFrame:
This supplementary schema outlines the key elements of Kandy's DSL, providing a quick reference to assist you in building your visualizations.
plot
For more examples, please see the Examples section.